View larger
Navicat Charts Creator
New product
Turn data into actionable insights with ease.
Transform your data into effective visualizations to identify trends, patterns and outliers. Simplify data analysis and share your workspaces to colleagues to better support your business decisions and strategies.
Pre-built data connectors.
Navicat Charts Creator allows you to swiftly and securely connect to any data source of your choice.

Relational DB
Connect to a number of different databases: MySQL, MariaDB, PostgreSQL, Oracle, SQLite and SQL Server.

ODBC
Import data from any ODBC data sources including Sybase, Snowflake and DB2.

File Types
Import data from external files such as Excel, Access, CSV, from data stored on your computer, network, or a URL.

Linked File
Link your chart to data in data sources to update the chart according to changes in the underlying data.
Build your own custom chart.
Inspire your organization to make better decisions.
Navicat Charts Creator supports a wide variety of chart types to illustrate your data in a meaningful way. Choosing the right type of chart can ensure that your questions are answered and your presentation conveys the message you want to communicate.
Give a good idea of the direction of the trend.
You can add a trend line to your chart to visualize the general trend in your data. Choose the type of trend line you want and format the trend line to make it even more understandable and easily interpreted. A trend line can be added to a variety of charts, including Bar Chart, Line Chart, Area Chart, Bar and Line Chart, and Scatter Chart.

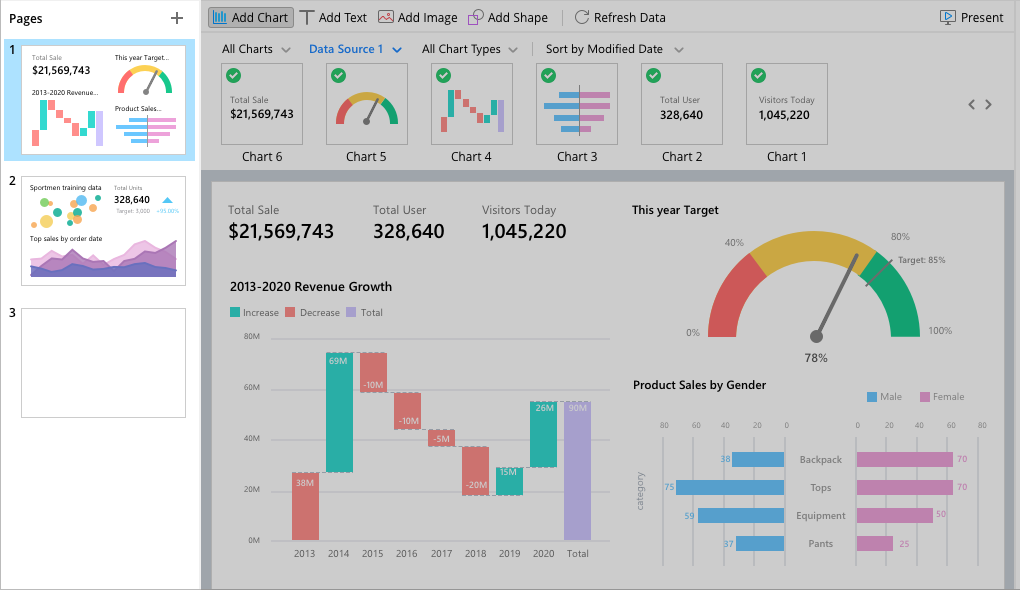
Create effective dashboards.
Design more powerful dashboards to uncover fresh insights that would otherwise go unnoticed.
Build an interactive dashboard to display a collection of your charts. Combine multiple views of data to gain a richer insight. You can also create separate dashboards for different topics that you would like to track.
Group Chart
Visualize related information for multiple charts. Show how related charts can be synchronized. Just simply hover over one chart to see the effect in the other charts.
Control Chart
Fine-tune your chart. Filter the data series in all charts in the dashboard within the same data source.
Page Style
Get a thumbnail preview of each dashboard. The thumbnail gives you a visual hint of the types of charts you have, so you can navigate among dashboards with ease.
Fully integrated with Navicat Collaboration.
Synchronize your chart workspace to our cloud solutions and invite your teammates to the project, where they can create and edit together.